
How to Use CFD Charts (Cumulative Flow Diagram)
A cumulative flow diagram (CFD) is one of the simplest ways to see how work moves through your system over time. Once you know how to read it, you can spot bottlenecks, rising WIP, and delivery risk in minutes.
What a CFD is (in plain English)
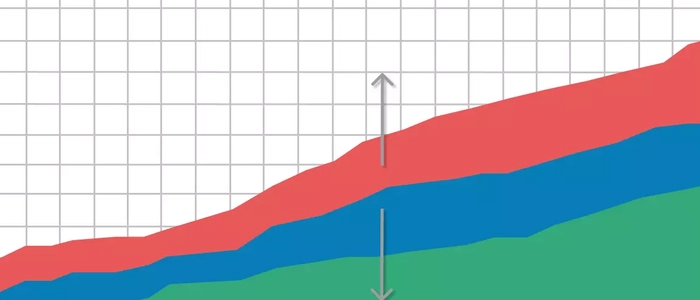
A Cumulative Flow Diagram shows how many items are in each workflow stage over time. Think of it like a “flow X-ray” for your process. Instead of debating opinions (“we’re overloaded”), a CFD shows what’s actually happening (“work is piling up in Review”).
What a CFD chart shows
Most CFDs have:
- X-axis: time (days/weeks)
- Y-axis: total number of work items
- Colored bands: each workflow stage (e.g., To Do / In Progress / Review / Done)
The thickness of a band tells you how many items are currently sitting in that stage.
How to read a CFD in 60 seconds
1) Look for widening bands (WIP is growing)
If a stage band gets thicker over time, items are entering that stage faster than they’re leaving. That stage is becoming a queue.
- Widening “In Progress” often means too much is started and not finished
- Widening “Review” often means approvals/testing/reviews are the real constraint
2) Look for parallel lines (stable flow)
When bands stay relatively consistent and boundaries look mostly parallel, your system is stable. Stable flow usually means more predictable lead time and fewer surprises.
3) Look at the “Done” slope (delivery rate)
If the “Done” line climbs steadily, your throughput is stable. If it flattens, delivery is slowing down—even if the team feels busy.
The 3 most common CFD patterns (and what they mean)
Pattern A: “Everything is thickening” (work is starting faster than finishing)
If multiple bands widen and total items rise, you’re accumulating WIP. The fix is usually not “work harder.” It’s to reduce started work and finish more before starting more.
Pattern B: “One band is ballooning” (you found the bottleneck)
If one stage expands (often Review), that stage is the constraint. Focus improvement there first: add review capacity, clarify criteria, limit new starts until the queue shrinks, and make review work visible.
Pattern C: “Sawtooth / jagged flow” (unpredictable batching)
If bands jump in big steps, your system is batching work (e.g., weekly reviews, big releases, bulk approvals). Smaller batch size and more frequent handoffs usually smooth flow and reduce delays.
How to build a CFD (practical options)
Option 1: Create a simple CFD from a physical or visual board
If you run a visual workflow board, you can create a CFD by taking a daily snapshot:
- Pick a consistent time each day (e.g., 3:00 PM)
- Count how many items are in each stage
- Log the counts (date + each column count)
- Chart it over time (each stage becomes a band)
This is enough to reveal where work is piling up and where flow is breaking down.
Option 2: Use your workflow system’s built-in CFD
Many Kanban-style tools can generate CFDs automatically. The key is not the tool—it’s consistent workflow definitions and keeping status accurate.
What to do after you read the CFD
A CFD is only useful if it drives action. Here are practical moves based on what you see:
If “In Progress” grows
- Stop starting new work until the queue shrinks
- Limit active work and focus on finishing
- Split large items into smaller deliverables
If “Review” grows
- Set a review SLA (example: 24–48 hours)
- Create scheduled review windows (twice daily)
- Define “review-ready” criteria to reduce back-and-forth
If “Done” slows
- Check where the thickest queue is (that’s your constraint)
- Reduce unplanned work or make it visible as a lane
- Focus improvement on the bottleneck stage first
How CFDs connect to the right metrics (without over-tracking)
CFDs are most powerful when paired with a small set of flow metrics. If you want one of the most improvement-friendly metric sets (and what to avoid), use Kaizen Metrics: What You Should Track (and Ignore).
To quantify how much time is real work versus waiting (which CFDs often reveal visually), use Flow Efficiency Formula (Explained So Anyone Can Use It).
CFDs support Kaizen (and Lean transformation) when used as a learning tool
CFDs aren’t about blaming teams—they’re about seeing the system. In a Kaizen mindset, the CFD helps you identify where to improve flow next and whether your changes actually worked.
If you’re deciding what to track (and what to ignore) during improvement work, use Kaizen Metrics: What You Should Track (and Ignore). For a broader view of how metrics fit into long-term change, use The Complete Guide to Lean Transformation.
Use visual planning + visual boards to make CFDs actionable
A CFD tells you what’s happening; your visual systems help you fix it. If your planning isn’t visible, teams often create invisible queues and surprise work.
- Use What Is Visual Scheduling? (Team-Based Planning Guide) to align teams on realistic work plans.
- Use Visual Workflows: How Seeing Work Improves Decision Making to improve clarity and reduce hidden delays.
- Use Visual Management Boards: Examples & Templates to keep workflow visible and trustworthy.
Common CFD mistakes (avoid these)
- Changing column definitions: keep workflow stages stable or your CFD becomes misleading
- Tracking too infrequently: weekly snapshots can hide daily queues—start daily if possible
- Ignoring item size: huge items distort the chart—split work smaller
- Reading the chart but not acting: pick one bottleneck and fix it every week
Related Articles
- Kaizen Metrics: What You Should Track (and Ignore)
- The Complete Guide to Lean Transformation
- What Is Visual Scheduling? (Team-Based Planning Guide)
- Visual Workflows: How Seeing Work Improves Decision Making
- Visual Management Boards: Examples & Templates
- Flow Efficiency Formula (Explained So Anyone Can Use It)