
You can’t improve a process you can’t see.
That’s the core idea behind Value Stream Mapping (VSM). It is a visual method used to understand how work actually flows — from request to delivery — and to identify waste, delays, and inefficiencies hiding inside everyday processes.
This guide explains Value Stream Mapping in simple terms, shows when to use it, and helps you understand why it’s one of the most powerful tools in Lean and Kaizen.
Short on time? Jump to the simple example, the 6 steps to create a map, or what to capture on each step.
What Is Value Stream Mapping?
Value Stream Mapping is a visual technique used to map every step required to deliver a product or service. It shows:
- What steps exist in the process
- How information flows between steps
- Where time is spent working vs waiting
- Where waste and bottlenecks occur
A value stream includes all actions — both value-adding and non-value-adding — required to move work from start to finish.
Why Value Stream Mapping Matters
Most teams try to improve performance by working harder or adding more tools. VSM takes a different approach: it improves performance by removing friction.
When teams visualize the full process, they often discover:
- Long wait times between steps
- Rework caused by unclear inputs
- Unnecessary handoffs and approvals
- Work piling up instead of flowing
These issues are rarely visible in task lists or dashboards — but they become obvious on a value stream map.
One of the most common outcomes of VSM is realizing that the system is constrained by a few points of delay. If you want a practical guide to identifying and fixing those constraints, start here: Bottlenecks: How to Identify and Remove Them.
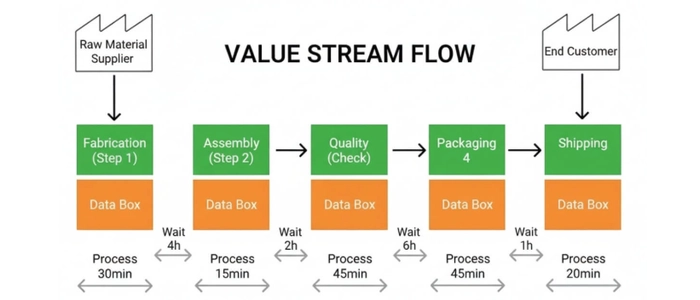
Value Stream Mapping Example: A Simple 5-Step Order Flow
Here is an illustrative example (the numbers are made up to show the math, not taken from a real company). An order moves through five steps: order entry, credit check, scheduling, production and shipping.
- Each step takes a short amount of hands-on work, for example 10 minutes to enter the order and a few hours to produce it.
- Between the steps, the order waits: in an inbox, in a queue for approval, or on a schedule that only runs once a day.
- When the team adds up the numbers, the hands-on work might total less than one day, while the order takes two weeks from request to delivery.
That gap between process time (work actually being done) and lead time (total elapsed time) is what a value stream map makes visible. In most maps, the biggest improvement opportunities sit in the waits between steps, not inside the steps themselves.
Current State vs Future State Mapping
Current State Map
The current state map documents how work actually flows today — not how it’s supposed to flow.
This step is critical. Skipping it leads to “solution-first” thinking and missed root causes.
Future State Map
The future state map shows how the process should flow after improvements are applied. It becomes a shared vision for change and a blueprint for action.
The gap between current and future state defines your improvement roadmap.
Many teams build both maps on a shared wall board so everyone can move steps around during the session. The Kaizen Analyze & Improve Board Set is a magnetic dry-erase value stream mapping board made for exactly this: map the current state, then design the future state on the same board.
Once you can see the gap clearly, the next step is turning insights into a structured improvement plan. This step-by-step guide walks you through that process: Value Stream Analysis: A Step-by-Step Beginner Guide.
How to Create a Value Stream Map in 6 Steps
- Pick one value stream and set the scope. Choose one product, service or request type, and agree on where the map starts and ends.
- Walk the process. Follow the work where it actually happens instead of mapping from memory in a meeting room.
- Use one card per process step. Place the steps left to right in the order the work flows.
- Add data to every step. Record the few numbers that explain how the step performs (see the table below).
- Mark waits, queues and handoffs. Note where work piles up and how long it waits, then add up lead time and process time.
- Draw the future state and list the actions. Rearrange the steps into the better flow, then write down who will do what to get there.
For the full analysis that comes after the map (finding root causes, prioritizing changes and building the improvement plan), see Value Stream Analysis: A Step-by-Step Beginner Guide.
What to Capture on Each Step
| Data point | What it tells you |
|---|---|
| Cycle time | How long the step takes to complete one unit of work |
| Changeover time | How long it takes to switch from one type of work to another |
| Uptime | How much of the available time the step can actually run |
| Work-in-progress (WIP) | How much work is waiting at or in front of the step |
| Wait time | How long work sits before the next step starts |
Keep it simple: a few reliable numbers per step beat a crowded map. To go deeper on the timing terms, see What Is Cycle Time? and What Is Takt Time?.
Mapping on a Physical Board vs Software
Software is useful for storing and sharing a finished map. For the mapping session itself, many teams prefer a physical board, because everyone can see the whole flow at once and move steps by hand while they discuss it.
If you map on a physical board, these PMXBOARD tools are built for it:
- Kaizen Analyze & Improve Board Set: a 32.5" x 38" magnetic dry-erase VSM board with 75 value-stream cards (30 Type 1 process steps, 30 Type 2 data cards, 15 Type 3 label strips), 2 fine card markers, 3 board markers, cleaning cloth and eraser.
- Value Stream Magnetic Cards - Type 1 (25 Pack): cards that represent process steps, with a headline band for the process name or activity title.
- Value Stream Magnetic Cards - Type 2 (25 Pack): four grey parameter rows for key data (e.g., cycle time, changeover, uptime, yield).
- Value Stream Magnetic Cards - Type 3 (15 Pack): mini label cards to label, connect, or identify process steps.
The card packs are compatible with all PMXBOARD Kaizen boards and standard magnetic whiteboards, so you can also add them to a board you already have.
What Problems Does Value Stream Mapping Solve?
Value Stream Mapping is especially effective when teams struggle with:
- Long lead times
- Unclear ownership between departments
- Too much work-in-progress
- Frequent delays and firefighting
Many of these problems are caused by waste. If you’re not familiar with waste categories, start here: 8 Wastes of Lean: How to Find and Remove Them.
How Value Stream Mapping Connects to Kaizen
VSM is not a one-time exercise. It is often the foundation for Kaizen events and continuous improvement efforts.
Teams use value stream maps to:
- Select improvement opportunities
- Prioritize actions with the highest impact
- Align stakeholders on what to fix first
This is why Value Stream Mapping is frequently used at the start of a Kaizen event. If you’re new to Kaizen, this guide provides helpful context: What Is Kaizen? A Beginner’s Guide to Continuous Improvement.
In the PMXBOARD Kaizen system, value stream mapping is Step 3 of the Complete Kaizen System: the Analyze & Improve board sits between selecting an opportunity and acting on it. The Complete Kaizen Board Set puts all six steps on one wall (Opportunities, Select, Analyze & Improve, Actions, Implementation, Test & Monitor) and includes the 75 value-stream cards. For running the whole event, see How to Run a Kaizen Event: Step-by-Step Playbook.
Common Mistakes Beginners Make
- Mapping only one department instead of the full flow
- Ignoring information flow and approvals
- Focusing on tools instead of flow
- Creating a map without turning it into actions
Value Stream Mapping is only useful when it leads to change. That’s why it’s often paired with structured improvement planning.
A simple way to close the loop: move every action from the future state map onto a Kaizen Actions Board, which has columns for Planned, In Progress, and Completed actions, and review it in your regular team huddle.
When Should You Use Value Stream Mapping?
VSM is most effective when:
- You need to improve lead time or delivery speed
- Multiple teams or roles are involved in a process
- Problems repeat despite local optimizations
Value Stream Mapping FAQ
How long does a value stream mapping session take?
It depends on the scope. A small office process can be mapped in a single working session, while a full product flow across several departments usually needs more time, including time to walk the process and collect data.
What is the difference between a current state and a future state map?
The current state map shows how work flows today. The future state map shows how it should flow after improvements. The actions that close the gap become your improvement plan.
What do I need to start value stream mapping?
A wall or board everyone can see, one card or note per process step, and a few data points per step. Many teams use a dedicated board such as the Kaizen Analyze & Improve Board Set, or add Type 1 and Type 2 value stream cards to a magnetic whiteboard they already own. Browse all Kaizen board sets.
Value Stream Mapping Is About Seeing the System
Value Stream Mapping shifts the conversation from “who is busy” to “where work gets stuck.”
By making the entire system visible, teams can stop guessing, stop blaming, and start improving with clarity.
You don’t need perfection to start. You just need visibility.